Blog: SmartDrive Publishes SmartDrive SmartIQ Beat Collision Operator Analysis for Transit
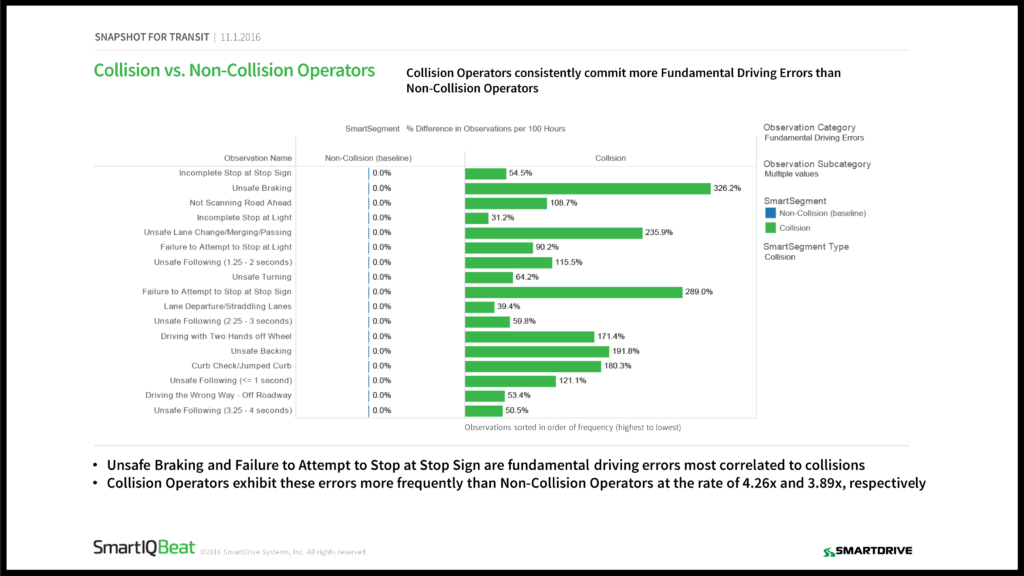
Snapshot clearly demonstrates collision operators commit significantly more fundamental driving errors, speed more frequently and are more distracted when compared to non-collision drivers.
In today’s Snapshot, we share new insights focused on the transit industry, examining operator performance related to collisions, a major cost driver and top public safety priority for transit agencies and fleets that carry passengers.
The SmartDrive Collision Snapshot for Transit illuminates key observations that distinguish collision operators (those involved in at least one collision during the 12-month analysis period) from non-collision operators. The data analysis clearly demonstrates that collision operators are less safe overall, commit significantly more fundamental driving errors, speed more frequently and are more distracted across the board when compared to non-collision drivers. Furthermore, it is evident that near-miss collisions—particularly those involving another vehicle or a stationary object—are a key indicator of future collisions. The full Collision Snapshot is available online, click here for the U.S. Snapshot or here for the UK Snapshot.
Significant findings related to collision operators, by the numbers, include:
- Safety score 136% worse than non-collision operators
- Talk hands-free and text at rates of 5.72 times and 5.23 times greater than non-collision operators
- 7 times higher near-collision rate
- Consistently exhibit more fundamental driving errors:
- 4.26 times more unsafe braking incidents
- Twice as many instances of not scanning the road ahead
- 3.35 times higher unsafe lane change/merging or passing events
The safety of passengers, operators and the motoring public are paramount for transit agencies and other fleets that transport the general public. When agency management and leaders can leverage insights like these developed from their own fleet performance data, they can identify relevant and predictive trends and develop targeted strategies to improve performance and gain competitive advantage.
This study was conducted by analyzing the SmartDrive database of over 140 million analyzed driving events and the accompanying continuous telematics data. Only transit industry customers were included in this study. Data presented covers the period from August 2015 through July 2016.
To download the study click on one of the links below.
U.S. Snapshot for Transit
UK Snapshot for Transit
- Posted by Melissa.Senoff@smartdrive.net
- On 2 November 2016
